FrameView Performance and Power Benchmarking App: Free Download Available Now
This article has been updated October 20, 2022 with the latest updates and information regarding FrameView 1.4
Graphics cards are investments, bought on the promise of delivering excellent performance in that card’s class for at least 2 to 3 years. It’s therefore important that the benchmarks of these cards, which you’re likely using as research, are accurate and cover all the bases, showing frame rates, frame times, power usage, performance per watt, and more.
To date, no single tool or app has accurately delivered these results, which is why we’ve created FrameView, an all-in-one benchmarking app that you can download and use for free.
FrameView can capture data from all major APIs and virtually all games thanks to support for DirectX 9, 10, 11 and 12, OpenGL, Vulkan, and Universal Windows Platform (UWP) applications.
It has a minimal, lightweight impact on performance while benchmarking, its integrated overlay enables you to view performance and stats during gameplay. It’s vendor agnostic, too -enabling the collection of detailed, comparative data. One exception: AMD’s GPU power consumption API reports a value in-between chip power and board power, rather than the true values.
In short, if you want to view or collect real-time GPU performance and power data in games, FrameView delivers more of it with a higher degree of accuracy than many other tools and methods, making it the go-to app for benchmarking.
FrameView In-Depth
If you wish to know more about the metrics FrameView measures, and why they’re important for your gaming experience, keep reading.
Performance Testing
All performance monitoring applications use system resources, affecting the recorded results. With our army of expert engineers we’ve been able to greatly reduce the cost of stat tracking and recording, giving you more accurate results.
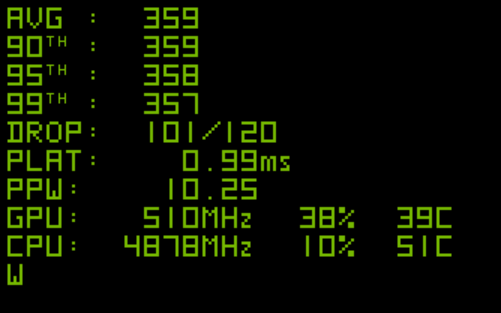
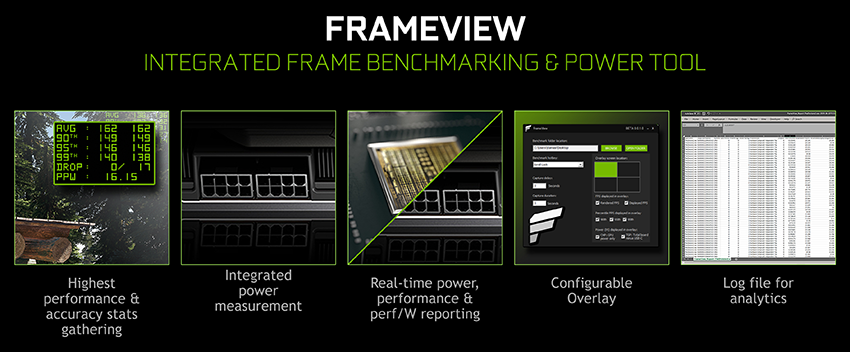
Our configurable overlay shows several performance metrics:
- Rendered Frame rate: FrameView will measure and report timestamps at the beginning of the graphics pipeline. This metric indicates the smoothness of the animation delivered to the GPU
- Displayed Frame rate: FrameView will measure and report timestamps at the end of the graphics pipeline. This metric provides an indicator of what the user actually sees displayed on screen
- 90th, 95th and 99th Percentile Frame rates: Reviewers typically use 99th percentile calculations to determine whether a game’s minimum frame rate or frame time is close to its average.
If the 99th percentile frame rates are close to the average, the game is smooth and consistent. If they’re not, the game’s frame rate is likely inconsistent, resulting in micro-stutter during gameplay, negatively affecting your experience - Rendering Present Latency: Rendering Present latency is the time from when present was called on the render thread to when the present was actually completed by the GPU. This measurement includes the driver’s latency, how long the command sat in the queue waiting for the GPU to render, and the actual GPU render time. Rendering latency can help determine how responsive a game can feel to an end user.
Pressing the benchmark hotkey assigned in the settings begins data capture for the predefined number of seconds, saving these and other stats to file. To maximize performance, the overlay is hidden while the benchmark is conducted.
Power Testing
Power efficiency is of critical importance in the world of GPUs. With better power efficiency you generate less heat, which means the GPU can be cranked up to higher levels, resulting in higher clock speeds, and giving the GPU’s designers the thermal and power capacity to add more Ray Tracing Cores and other doodads to the chip.
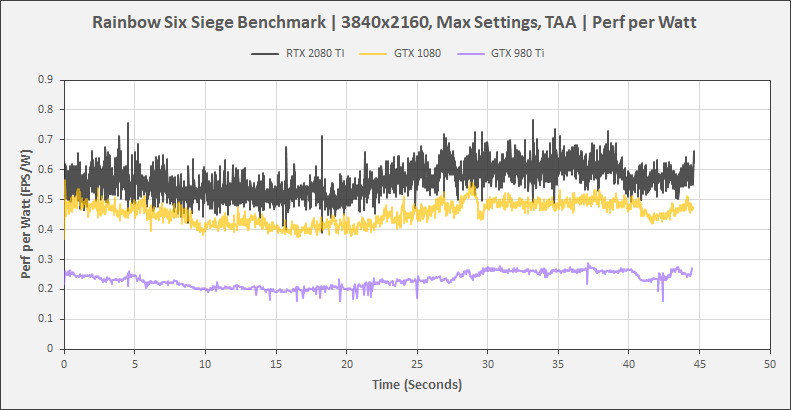
Power efficiency comes from all aspects of a graphics card’s design, not just the size of the process node it was built on. In the case of GeForce RTX graphics cards, numerous industry-firsts enable unprecedented performance efficiency on a 12nm process node, that is still to date more efficient than any other architecture. And of course, with increased performance efficiency comes better overall performance-per-watt, giving you more frames for every watt of power.
Altogether, this means you get a faster GPU that operates at lower temperatures, enabling quieter fan speeds, ensuring your gaming isn’t drowned out by fan noise. And when you’re not gaming, the GPU has quieter or even idle
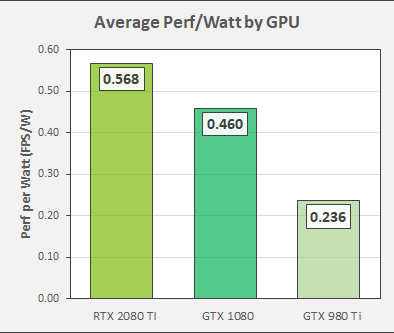
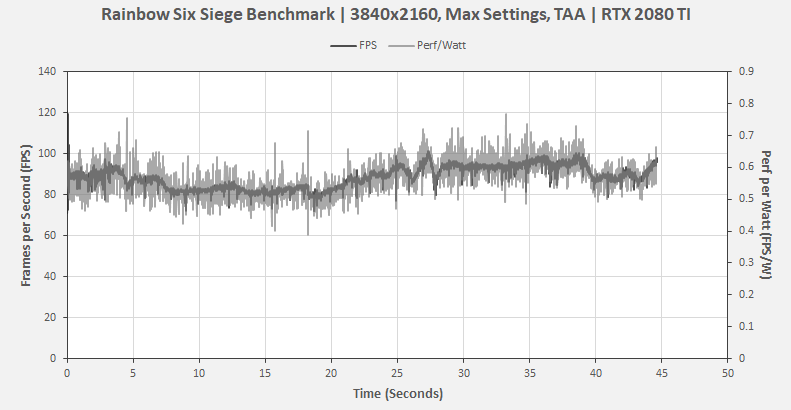
PPW, meanwhile, represents the perf per watt every 100 milliseconds, calculated as F/J = (F/S) / (J/S):
F/J = Frame Rate ÷ Joules
One Joule: equivalent of one watt of power radiated or dissipated for one second
(F/S) = Frames per second (FPS)
(J/S) = Watts per second (TGP)
Performance per Watt = FPS ÷ TGP
If you’d prefer to know the performance per watt using CHP chip power, the data is available in the saved log files, telling you the level of performance efficiency across your entire benchmark.
Data Analysis
When you initiate a FrameView benchmark, over 40 metrics are collected and saved using a variety of methods including PresentMon, an open source tool that tracks performance events in Windows. By integrating these low level data collectors with FrameView, anyone can now use it with a single press of their benchmarking key.
With the FrameView 1.4 installer, we have included an Excel Template with embedded VBA scripts to make analyzing frameview CSV log files fast and easy. Additionally, a Summary File is saved to help keep track of your high level stats per benchmark and a reference to each particular log. No more having to rerun benchmarks because you forgot to label the results file!
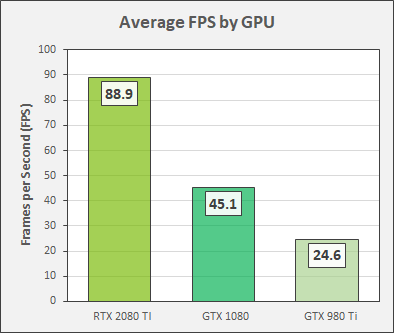
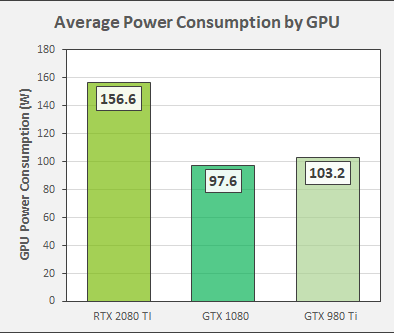
Using the Excel Analysis Template, you can get the charts below by just clicking a button and browsing to the Log File of choice.
Want To Learn More?
If you’re interested in learning more about the topics discussed here, and want to get detailed info on how to use all of FrameView’s analytical tools, download our comprehensive User Guide, and our Power Primer.
FrameView: Available Now, For Free
To get FrameView, simply head here and click the big ‘ol download button. If you want to see what’s new with FrameView, check out the release notes page for the latest on new features, support, and improvements.
If you have any feedback regarding FrameView, or feature suggestions, let us know in the comments below.


