Zillow 是美國最大的房地產資訊市場之一,也是具備影響力的機器學習 (ML) 領先企業。Zillow Research 使用機器學習模型分析每件房地產上的數百個資料點,來估算房屋價值並預測市場變化。在本章節中,我們會介紹如何使用 Apache Spark 機器學習隨機森林迴歸來預測區域內房屋銷售的中間價格。請注意,目前在 Spark 機器學習中,只有 XGBoost 使用 GPU 加速,我們將在下一章節介紹此主題。
使用 Apache Spark 機器學習預測房屋價格
分類和迴歸
分類和迴歸是兩種監督式機器學習演算法的類型。監督式機器學習 (也稱為預測分析) 利用演算法在標籤資料中尋找模式,接著使用能辨識這些模式的模型來預測新資料上的標籤。分類和迴歸演算法採用帶有標籤 (也稱為目標結果) 和特徵 (也稱為屬性) 的資料集,並學習如何根據這些資料特徵為新資料加上標籤。

分類判斷各種項目的所屬類別,例如信用卡交易是否合法。迴歸則預測連續的數值,例如房價。
迴歸
迴歸估計目標結果相依變數 (標籤) 與一或多個獨立變數 (特徵) 之間的關係。迴歸可用於分析標籤與特徵變數之間關係的強度,判斷標籤在一個或多個特徵變數調整下的變化程度,並預測標籤和特徵變數之間的趨勢。
我們來看看線性迴歸的房價範例,並將歷史房價和房屋特徵 (平方英尺、臥室數量、地點等) 列入考慮:
- 我們想預測什麼?
這是標籤:房價 - 您可以使用哪些資料屬性進行預測?
這些是特徵:若要建立迴歸模型,您可以將與標籤關係最密切、且對預測內容貢獻最大的相關特徵擷取出來。
在下列範例中,我們使用房子大小作為特徵。

線性迴歸將 Y "標籤"和 X "特徵", in this case the relationship between the house price and size, with the equation: Y =之間的關係建立模型,方程式為截距 + (係數 * X) + 誤差。係數測量該特徵對標籤的影響,在本範例中為房屋大小對價格的影響。

多元線性迴歸將兩個或多個"特徵"與"標籤之間的關係建立模型。"舉例來說,如果我們想將價格和房屋大小、臥室數量和浴室數量之間的關係建立模型,則多元線性迴歸的函式會看起來像這樣:
Yi =β0 + β1X1 + β2X2 + · · · + βp Xp + Ɛ
Price =截距 + (係數 1 大小) + (係數 2 臥室) + (係數 3 * 浴室) + 誤差。
係數測量每個特徵對價格的影響。
決策樹
決策樹所建立的模型會透過評估一組遵循條件判斷式 (if-then-else) 模式的規則來預測標籤。如果條件判斷式的特徵問題是節點,則答案「是」或「否」就是子結點的分枝。
決策樹模型會預估若要評估做出正確決策的可能性,其所需的是/否問題的最少數量。 決策樹可用於分類以預測類別或類別可能性,或用於迴歸以預測連續數值。以下是預測房價的簡化決策樹範例:
- Q1:是否房子的大小 >2000 平方英尺
- T:Q2:是否臥室數量 >3
- T:Q3:是否浴室數量 >3
- T: Price=400,000 美元
- F: Price=200,000 美元
- T:Q3:是否浴室數量 >3
- T:Q2:是否臥室數量 >3

隨機森林
集成學習演算法結合了多種機器學習演算法,以取得更佳的模型。隨機森林是很受歡迎的分類和迴歸集成學習法。該演算法根據訓練階段的不同資料子集,建立由多個決策樹組成的模型。預測是透過結合所有決策樹的輸出,減少變異數並提高預測精準度。 對於隨機森林分類,標籤的預測為大部分決策樹預測的類別。對於隨機森林迴歸,標籤是單一決策樹的平均迴歸預測。

Spark 提供以下迴歸演算法:
- 線性迴歸
- 通用線性迴歸
- 決策樹迴歸
- 隨機森林迴歸
- 梯度提升決策樹迴歸
- XGBoost 迴歸
- 存活迴歸
- 保序迴歸
機器學習工作流程
機器學習是個反覆迭代過程,其中涉及:
- 擷取、轉換、載入 (ETL) 和分析歷史資料,來擷取顯著的特徵和標籤。
- 訓練、測試和評估機器學習演算法的結果來建立模型。
- 利用生產中的模型與新資料進行預測。
- 使用新資料進行模型監控和模型更新。
使用 Spark 機器學習管線
要使機器學習演算法使用這些特徵和標籤,必須將其放入特徵向量中,使用數量的向量表示每個特徵的數值。特徵向量用於訓練、測試和評估機器學習演算法的結果,來建立最佳模型。

參考學習 Spark
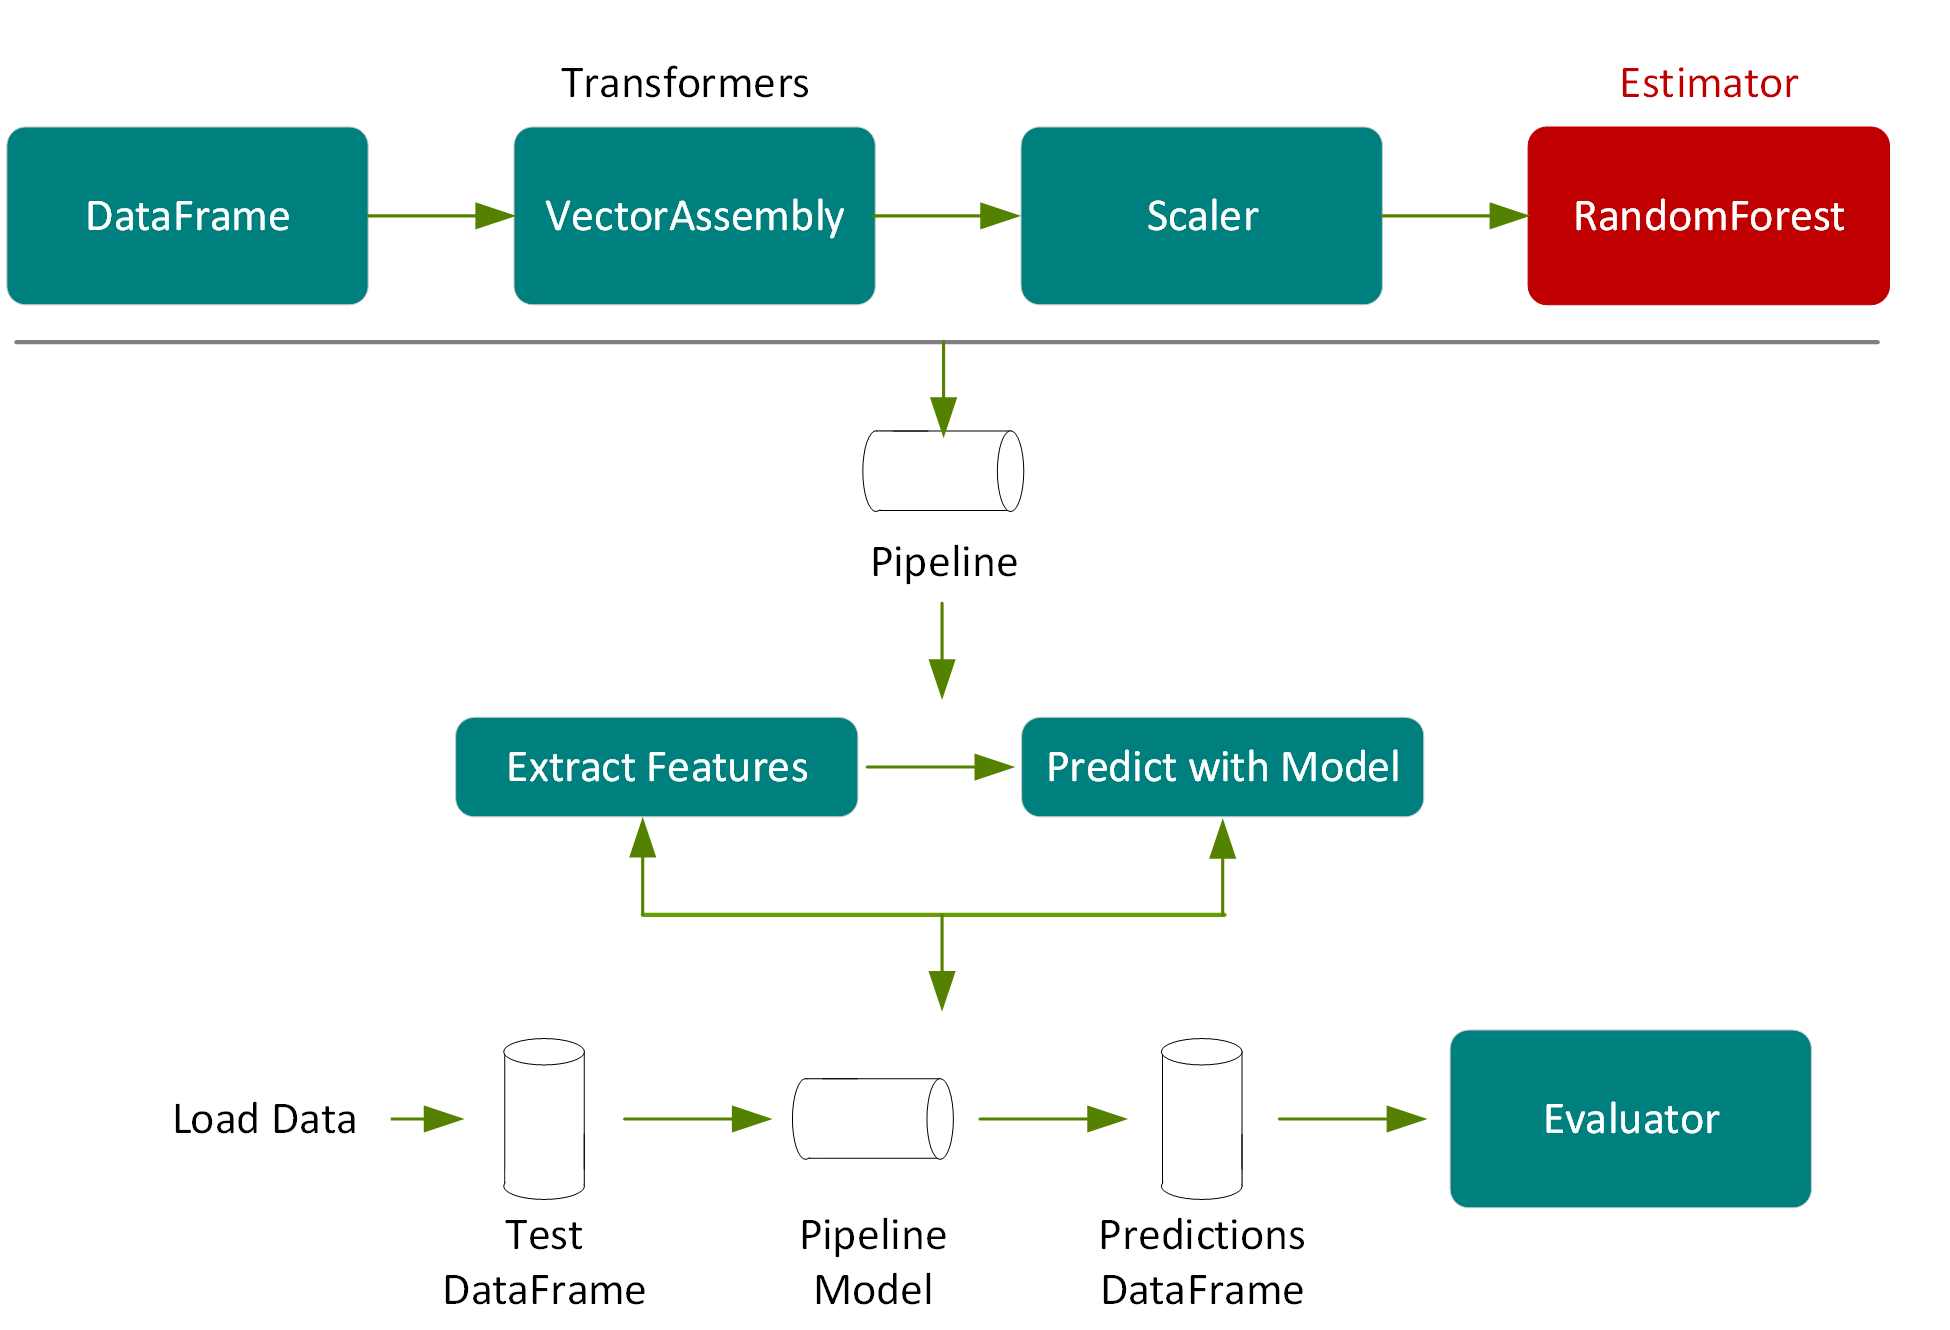
Spark 機器學習提供一套統一的高階 API,建立在 DataFrame 之上,用來建立機器學習管線或工作流程。在 DataFrame 上建立機器學習管線,提供分割區資料處理的可擴充性,便於 SQL 進行資料操作。

我們使用 Spark 機器學習管線來傳遞資料,將其通過轉換器並擷取特徵、通過估計器來產生模型,及通過評估器來測量模型準確性。
- 轉換器 (Transformer):轉換器是將一個 DataFrame 轉換為另一個 DataFrame 的演算法。我們會使用轉換器來建立具有特徵向量欄的 DataFrame。
- 估計器 (Estimator):估計器是一種演算法,可以安裝在 DataFrame 上產生轉換器。我們會使用估計器來訓練模型,並返還模型轉換器,該轉換器可在具有特徵向量欄的 DataFrame 上新增預測欄。
- 管線:管線將多個轉換器和估算器串聯在一起,來指定機器學習工作流程。
- 評估器 (Evaluator):評估器測量標籤和預測 DataFrame 列上的受訓練模型其準確性。
範例使用案例資料集
在此範例中,我們會使用來自 StatLib 儲存庫的加州房價資料集。此資料集包含 20,640 筆記錄,是根據 1990 年加州人口普查的資料,其中每筆記錄代表一個地理區塊。以下清單提供資料集屬性的描述。
- 房屋價值中位數:一個街區內房屋的房價中位數 (以千美元計)。
- 經度:東/西測量,數值愈高代表愈靠西邊。
- 緯度:南/北測量,數值愈高代表愈靠北邊。
- 屋齡中位數:一個街區內房屋的中位屋齡,數值愈低代表愈新。
- 總房間數:一個街區內的房間總數。
- 臥室總數:一個街區內的臥室總數。
- 人口:居住在街區內的總人數。
- 家庭:一個街區的家庭總數。
- 收入中位數:一個街區內房屋的家庭收入中位數 (以萬美元計)。
To build a model, you extract the features that most contribute to the prediction. In order to make some of the features more relevant for predicting the median house value, instead of using totals we’ll calculate and use these ratios: rooms per house=total rooms/households, people per house=population/households, and bedrooms per rooms=臥室總數/房間總數。
在這個案例中,我們在以下標籤和特徵上使用隨機森林迴歸:
- 標籤 → 房屋價值中位數
- 特徵 → {"屋齡中位數"、"收入中位數"、"每間房子的房間數量"、"每間房子的人口"、"每間房子的臥室數量"、"經度、""緯度"}
從檔案載入資料至 DataFrame 中

第一步是將資料載入至 DataFrame 中。在以下程式碼中,我們指定資料來源和模式以載入至資料集。
import org.apache.spark._
import org.apache.spark.ml._
import org.apache.spark.ml.feature._
import org.apache.spark.ml.regression._
import org.apache.spark.ml.evaluation._
import org.apache.spark.ml.tuning._
import org.apache.spark.sql._
import org.apache.spark.sql.functions._
import org.apache.spark.sql.types._
import org.apache.spark.ml.Pipeline
val schema =StructType(Array(
StructField("longitude", FloatType,true),
StructField("latitude", FloatType, true),
StructField("medage", FloatType, true),
StructField("totalrooms", FloatType, true),
StructField("totalbdrms", FloatType, true),
StructField("population", FloatType, true),
StructField("houshlds", FloatType, true),
StructField("medincome", FloatType, true),
StructField("medhvalue", FloatType, true)
))
var file ="/path/cal_housing.csv"
var df =spark.read.format("csv").option("inferSchema", "false").schema(schema).load(file)
df.show
result:
+---------+--------+------+----------+----------+----------+--------+---------+---------+
|longitude|latitude|medage|totalrooms|totalbdrms|population|houshlds|medincome|medhvalue|
+---------+--------+------+----------+----------+----------+--------+---------+---------+
| -122.23| 37.88| 41.0| 880.0| 129.0| 322.0| 126.0| 8.3252|452600.0|
| -122.22| 37.86| 21.0| 7099.0| 1106.0| 2401.0| 1138.0| 8.3014|358500.0|
| -122.24| 37.85| 52.0| 1467.0| 190.0| 496.0| 177.0| 7.2574| 352100.0|
+---------+--------+------+----------+----------+----------+--------+---------+---------+
In the following code example, we use the DataFrame withColumn() transformation, to add columns for the ratio features: rooms per house=total rooms/households, people per house=population/households, and bedrooms per rooms=total bedrooms/total rooms. 接著,我們為 DataFrame 建立快取並建立一個臨時視覺圖表,以建立更佳效能並方便使用 SQL。
// 為特徵建立比率
df =df.withColumn("roomsPhouse", col("totalrooms")/col("houshlds"))
df =df.withColumn("popPhouse", col("population")/col("houshlds"))
df =df.withColumn("bedrmsPRoom", col("totalbdrms")/col("totalrooms"))
df=df.drop("totalrooms","houshlds", "population" , "totalbdrms")
df.cache
df.createOrReplaceTempView("house")
spark.catalog.cacheTable("house")
摘要統計
Spark DataFrame 包括一些用於統計處理的內建函式。Describe() 函式在數值欄上執行摘要統計計算,並以 DataFrame 的形式回傳。以下程式碼會顯示標籤和部分特徵的統計資料。
df.describe("medincome","medhvalue","roomsPhouse","popPhouse").show
result:
+-------+------------------+------------------+------------------+------------------+
|summary| medincome| medhvalue| roomsPhouse| popPhouse|
+-------+------------------+------------------+------------------+------------------+
| count| 20640| 20640| 20640| 20640|
| mean|3.8706710030346416|206855.81690891474| 5.428999742190365| 3.070655159436382|
| stddev|1.8998217183639696|115395.61587441359|2.4741731394243205| 10.38604956221361|
| min| 0.4999| 14999.0|0.8461538461538461|0.6923076923076923|
max| 15.0001| 500001.0| 141.9090909090909|1243.3333333333333|
+-------+------------------+------------------+------------------+------------------+
DataFrame Corr() 函式計算 DataFrame 兩欄之間的皮爾森積差相關係數。這是根據變異法來測量兩個變數之間的統計關係。 相關係數的數值範圍從 1 到 -1,其中 1 表示完全正相關,-1 表示完全負相關,0 表示無相關。以下我們可看到收入中位數和房價中位數之間有正相關關係。
df.select(corr("medhvalue","medincome")).show()
+--------------------------+
|corr(medhvalue, medincome)|
+--------------------------+
| 0.688075207464692|
+--------------------------+
在以下散佈圖上,Y 軸上的房價中位數和 X 軸上的收入中位數顯示兩者之間有線性的相關關係。

以下程式碼使用 DataFrame 的 randomSplit 方法,將資料集隨機分為兩組,其中 80% 用於訓練,20% 用於測試。
val Array(trainingData, testData) =df.randomSplit(Array(0.8, 0.2), 1234)
特徵擷取和管線
以下程式碼建立向量合併器 (VectorAssembler) (轉換器),該轉換器在管線中會將指定欄清單合併為單一特徵向量欄。
val featureCols =Array("medage", "medincome", "roomsPhouse", "popPhouse", "bedrmsPRoom", "longitude", "latitude")
//將特徵放入特徵向量欄中
val assembler =new
VectorAssembler().setInputCols(featureCols).setOutputCol("rawfeatures")
以下程式碼會建立標準化 (StandardScaler) (轉換器),該轉換器在管線中利用 DataFrame 欄摘要統計資訊,將特徵標轉化為單位變異數,使特徵標準化。
val scaler =new
StandardScaler().setInputCol("rawfeatures").setOutputCol("features").setWithStd(true.setWithMean(true)
在管線中執行這些轉換器的結果,是在資料集內加入標準化的特徵欄,如下圖所示。

管線中的最後一個元素是隨機森林迴歸因子 (RandomForestRegressor) (估計器),此估計器訓練特徵和標籤的向量,然後回傳隨機森林迴歸因子模型 (轉換器)。
val rf =new
RandomForestRegressor().setLabelCol("medhvalue").setFeaturesCol("features")
在下列範例中,我們將向量合併器、標準化和隨機森林迴歸器放置於管線中。管線將多個轉換器和估計器串聯在一起,來指定用於訓練和使用模型的機器學習工作流程。
val steps = Array(assembler, scaler, rf)
val pipeline =new Pipeline().setStages(steps)

訓練模型
Spark 機器學習支援一種稱為 k-fold 交叉驗證的技術,透過嘗試不同的參數組合來判斷哪個機器學習演算法的參數值會產生最佳模型。透過 k-fold 交叉驗證,資料會隨機分為 k 個分割區。每個分割區都會被使用一次作為測試資料集,其餘分割區則用於訓練。接著使用訓練集產生模型,並與測試集一起進行評估,從而生成 k 模型精準度測量。造就最高精準度測量的模型參數,就會產生最佳模型。

Spark 機器學習支援 k-fold 交叉驗證,採用轉換/估計管線,透過使用稱為網格搜尋 (grid search) 的流程來嘗試不同參數組合,從而在交叉驗證工作流程中設定參數並進行測試。

以下程式碼使用 ParamGridBuilder 來建構模型訓練的參數網格。我們定義了迴歸評估器,該評估器會比較測試中位數值欄與測試預測欄來評估模型。我們使用交叉驗證器 (CrossValidator) 進行模型選擇。交叉驗證器使用管線、參數網格和評估器來配合訓練資訊集並回傳最佳模型。交叉驗證器使用 ParamGridBuilder,透過 maxDepth、maxBins,及隨機森林迴歸估計器的 numbTrees 參數進行反覆迭代,並將每個參數值重複三次後獲得可靠的結果來評估模型。
val paramGrid =new ParamGridBuilder()
.addGrid(rf.maxBins, Array(100, 200))
.addGrid(rf.maxDepth, Array(2, 7, 10))
.addGrid(rf.numTrees, Array(5, 20))
.build()
val evaluator =new RegressionEvaluator()
.setLabelCol("medhvalue")
.setPredictionCol("prediction")
.setMetricName("rmse")
val crossvalidator =new CrossValidator()
.setEstimator(pipeline)
.setEvaluator(evaluator)
.setEstimatorParamMaps(paramGrid)
.setNumFolds(3)
// 擬合訓練資料集並回傳模型
val pipelineModel =crossvalidator.fit(trainingData)
接下來我們就能取得最佳模型,並將特徵重要性列印出來。結果顯示收入中位數、每戶人口和經度是最重要的特徵。
val featureImportances =pipelineModel
.bestModel.asInstanceOf[PipelineModel]
.stages(2)
.asInstanceOf[RandomForestRegressionModel]
.featureImportances
assembler.getInputCols
.zip(featureImportances.toArray)
.sortBy(-_._2)
.foreach { case (feat, imp) =>
println(s"feature: $feat, importance: $imp") }
result:
feature: medincome, importance: 0.4531355014139285
feature: popPhouse, importance: 0.12807843645878508
feature: longitude, importance: 0.10501162983981065
feature: latitude, importance: 0.1044621179898163
feature: bedrmsPRoom, importance: 0.09720295935509805
feature: roomsPhouse, importance: 0.058427239343697555
feature: medage, importance: 0.05368211559886386
在以下範例中,我們使用交叉驗證流程來取得產生最佳隨機森林模型的參數,回傳結果為:最大深度為 2,最大箱 (bin) 為 50 和 5 個決策樹。
val bestEstimatorParamMap =pipelineModel
.getEstimatorParamMaps
.zip(pipelineModel.avgMetrics)
.maxBy(_._2)
._1
println(s"Best params:\n$bestEstimatorParamMap")
result:
rfr_maxBins: 50,
rfr_maxDepth: 2,
rfr_-numTrees: 5
預測和模型評估
接下來,我們使用測試 DataFrame (即原始 DataFrame 被隨機切分的 20%) 來測量模型的準確性,且不用於訓練。

在以下程式碼中,我們呼叫管線模型上的轉換,測試 DataFrame 便會根據管線步驟被傳遞通過特徵擷取階段,用模型微調選擇的隨機森林模型進行預估,然後在新的 DataFrame 欄中回傳預測。
val predictions =pipelineModel.transform(testData)
predictions.select("prediction", "medhvalue").show(5)
result:
+------------------+---------+
| prediction|medhvalue|
+------------------+---------+
|104349.59677450571| 94600.0|
| 77530.43231856065| 85800.0|
|111369.71756877871| 90100.0|
| 97351.87386020401| 82800.0|
+------------------+---------+
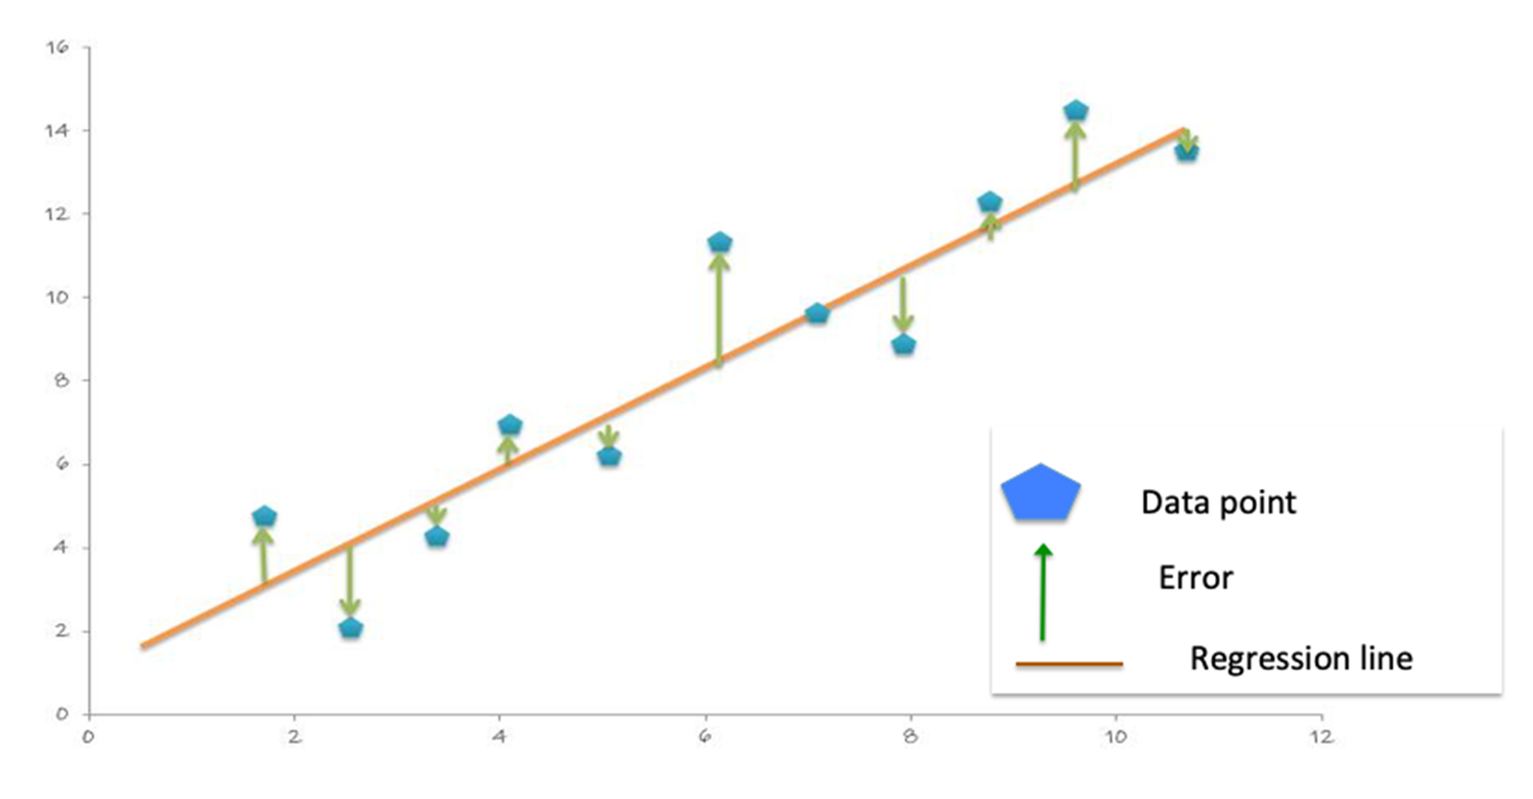
With the predictions and labels from the test data, we can now evaluate the model. To evaluate the linear regression model, you measure how close the predictions values are to the label values. The error in a prediction, shown by the green lines below, is the difference between the prediction (the regression line Y value) and the actual Y value, or label. (Error =prediction-label).

平均絕對誤差 (MAE) 是標籤和模型預測之間絕對差異的平均值。絕對值會將任何負號移除。
MAE =sum(absolute(prediction-label)) / number of observations).
The Mean Square Error (MSE) is the sum of the squared errors divided by the number of observations. The squaring removes any negative signs and also gives more weight to larger differences. (MSE =sum(squared(prediction-label)) / number of observations).
均方差 (RMSE) 是 MSE 的平方根。RMSE 是預測誤差的標準差。誤差是在衡量迴歸線和標籤資料點之間的距離,RMSE 則是在衡量這些誤差的分佈情況。
The following code example uses the DataFrame withColumn transformation, to add a column for the error in prediction: error=prediction-medhvalue。接著,我們顯示預測的摘要統計、房價中位數和錯誤 (以千美元計)。
predictions =predictions.withColumn("error",
col("prediction")-col("medhvalue"))
predictions.select("prediction", "medhvalue", "error").show
result:
+------------------+---------+-------------------+
| prediction|medhvalue| error|
+------------------+---------+-------------------+
| 104349.5967745057| 94600.0| 9749.596774505713|
| 77530.4323185606| 85800.0| -8269.567681439352|
| 101253.3225967887| 103600.0| -2346.677403211302|
+------------------+---------+-------------------+
predictions.describe("prediction", "medhvalue", "error").show
result:
+-------+-----------------+------------------+------------------+
|summary| prediction| medhvalue| error|
+-------+-----------------+------------------+------------------+
| count| 4161| 4161| 4161|
| mean|206307.4865123929|205547.72650805095| 759.7600043416329|
| stddev|97133.45817381598|114708.03790345002| 52725.56329678355|
| min|56471.09903814694| 26900.0|-339450.5381565819|
| max|499238.1371374392| 500001.0|293793.71945819416|
+-------+-----------------+------------------+------------------+
以下程式碼範例使用 Spark 迴歸評估器計算預測 DataFrame 上的 MAE,結果回傳為 36636.35 (以千美元計)。
val maevaluator =new RegressionEvaluator()
.setLabelCol("medhvalue")
.setMetricName("mae")
val mae =maevaluator.evaluate(predictions)
result:
mae: Double =36636.35
以下程式碼範例使用 Spark 迴歸評估器計算預測 DataFrame 上的 RMSE,結果回傳為 52724.70。
val evaluator =new RegressionEvaluator()
.setLabelCol("medhvalue")
.setMetricName("rmse")
val rmse =evaluator.evaluate(predictions)
result:
rmse: Double =52724.70

儲存模型
現在,我們可以將擬合過的管線模型儲存到分散式檔案庫,以供之後的實際生產環境使用。這樣可省去特徵擷取階段和模型微調選擇的隨機森林模型步驟。
pipelineModel.write.overwrite().save(modeldir)
儲存管線模型的結果是用於中繼資料的 JSON 檔案和用於模型資料的 Parquet。我們可以用載入命令重新載入模型;原始模型和重新載入的模型是相同的:
val sameModel =CrossValidatorModel.load(“modeldir")
摘要
在本章節中,我們討論了迴歸、決策樹和隨機森林演算法。我們涵蓋了 Spark 機器學習管線的基本原理,並以實際範例預測房價中位數。