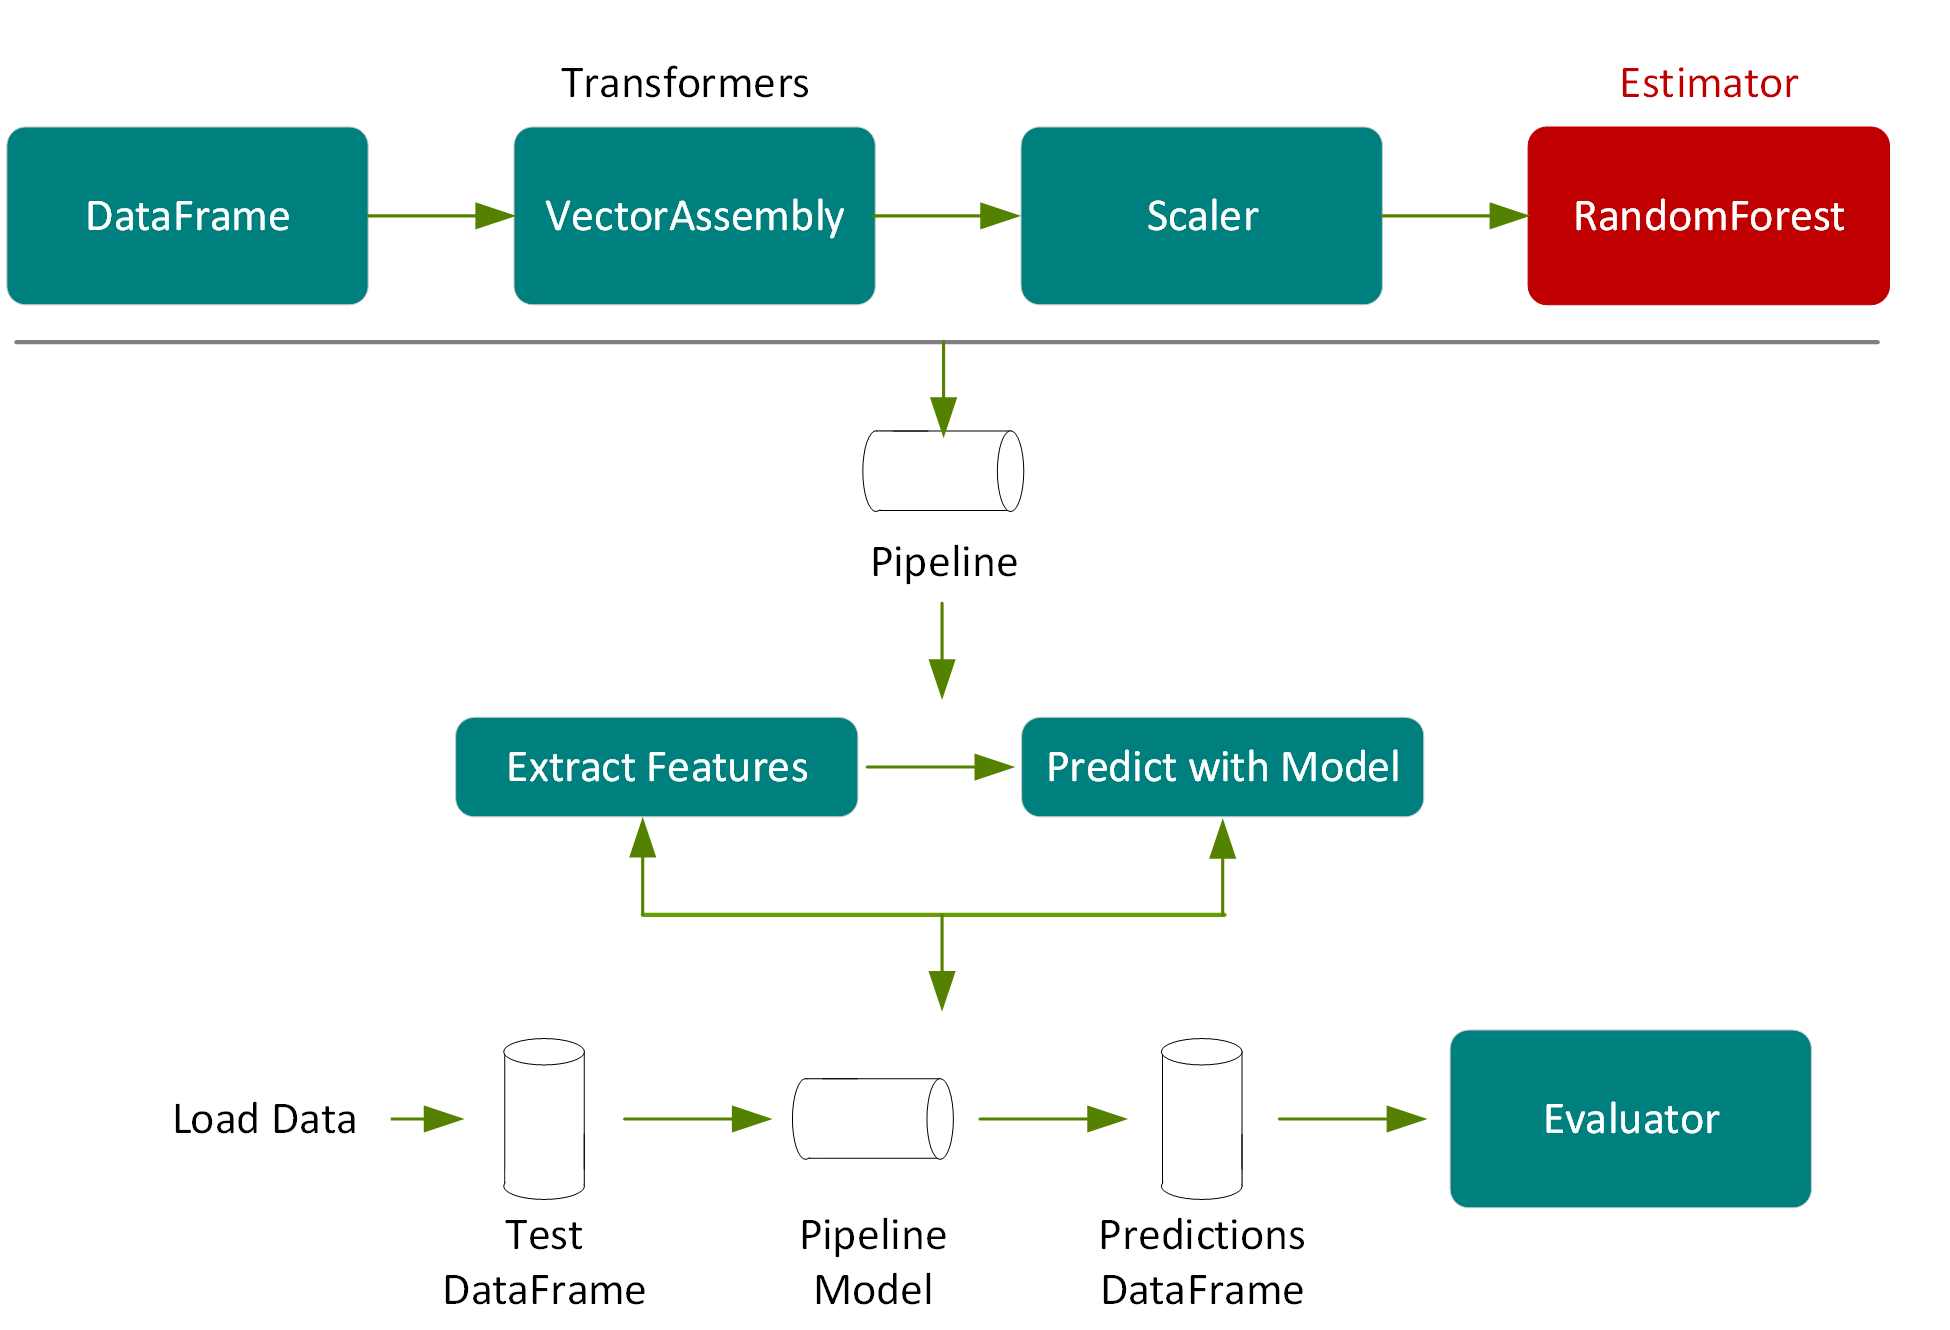
首先,我們匯入 Spark xgboost 的 GPU 版本和 CPU 版本所需的套件:
import org.apache.spark.sql.functions._
import org.apache.spark.sql.types._
import org.apache.spark.sql._
import org.apache.spark.ml._
import org.apache.spark.ml.feature._
import org.apache.spark.ml.evaluation._
import org.apache.spark.sql.types._
import ml.dmlc.xgboost4j.scala.spark.{XGBoostRegressor, XGBoostRegressionModel}
針對 Spark xgboost 的 GPU 版本,您需要匯入以下內容:
import ml.dmlc.xgboost4j.scala.spark.rapids.{GpuDataReader, GpuDataset}
我們指定架構為 Spark StructType。
lazy val schema =
StructType(Array(
StructField("vendor_id", DoubleType),
StructField("passenger_count", DoubleType),
StructField("trip_distance", DoubleType),
StructField("pickup_longitude", DoubleType),
StructField("pickup_latitude", DoubleType),
StructField("rate_code", DoubleType),
StructField("store_and_fwd", DoubleType),
StructField("dropoff_longitude", DoubleType),
StructField("dropoff_latitude", DoubleType),
StructField(labelName, DoubleType),
StructField("hour", DoubleType),
StructField("year", IntegerType),
StructField("month", IntegerType),
StructField("day", DoubleType),
StructField("day_of_week", DoubleType),
StructField("is_weekend", DoubleType)
))
在以下程式碼中,我們將建立一個 Spark 工作階段並設定訓練和評估資料的檔案路徑。(注意:如果您使用的是筆記型電腦,則不需要建立 Spark 工作階段。)
val trainPath ="/FileStore/tables/taxi_tsmall.csv"
val evalPath ="/FileStore/tables/taxi_esmall.csv"
val spark =SparkSession.builder().appName("Taxi-GPU").getOrCreate
我們將 CSV 檔案中的資料載入至 Spark DataFrame 中,指定資料來源和架構以載入 DataFrame 中,如下所示。
val tdf =spark.read.option("inferSchema",
"false").option("header", true).schema(schema).csv(trainPath)
val edf =spark.read.option("inferSchema", "false").option("header",
true).schema(schema).csv(evalPath)
DataFrame show(5) 顯示前 5 列:
tdf.select("trip_distance", "rate_code","fare_amount").show(5)
result:
+------------------+-------------+-----------+
| trip_distance| rate_code|fare_amount|
+------------------+-------------+-----------+
| 2.72|-6.77418915E8| 11.5|
| 0.94|-6.77418915E8| 5.5|
| 3.63|-6.77418915E8| 13.0|
| 11.86|-6.77418915E8| 33.5|
| 3.03|-6.77418915E8| 11.0|
+------------------+-------------+-----------+
Describe() 函式回傳包含描述性摘要統計的 DataFrame,例如每個數值欄的計數、平均值、標準偏差及最小值和最大值。
tdf.select("trip_distance", "rate_code","fare_amount").describe().show
+-------+------------------+--------------------+------------------+
|summary| trip_distance| rate_code| fare_amount|
+-------+------------------+--------------------+------------------+
| count| 7999| 7999| 7999|
| mean| 3.278923615451919|-6.569284350812602E8|12.348543567945994|
| stddev|3.6320775770793547|1.6677419425906155E8|10.221929466939088|
| min| 0.0| -6.77418915E8| 2.5|
| max|35.970000000000006| 1.957796822E9| 107.5|
+-------+------------------+--------------------+------------------+
下方的散佈圖用於探索車資金額和車程距離之間的相關性。
%sql
select trip_distance, fare_amount
from taxi


